
What is the Ease of Doing Business Score?
The primary objective of the Doing Business North America report is to provide a measure of the ease of doing business for cities in North America. At least one city per state or province was scored. The District of Columbia was included as well. For states with much larger populations than average, more cities (up to four of the largest in the state or province) were included. The Ease of Doing Business Score is derived from a summation of the scores awarded in each of the six categories measured by this report. The Ease of Doing Business Score focuses on the regulatory burdens a small- to medium-sized business would face from the birth of the business to the death of the business in cities across North America. The following explains the process of arriving at the final score.
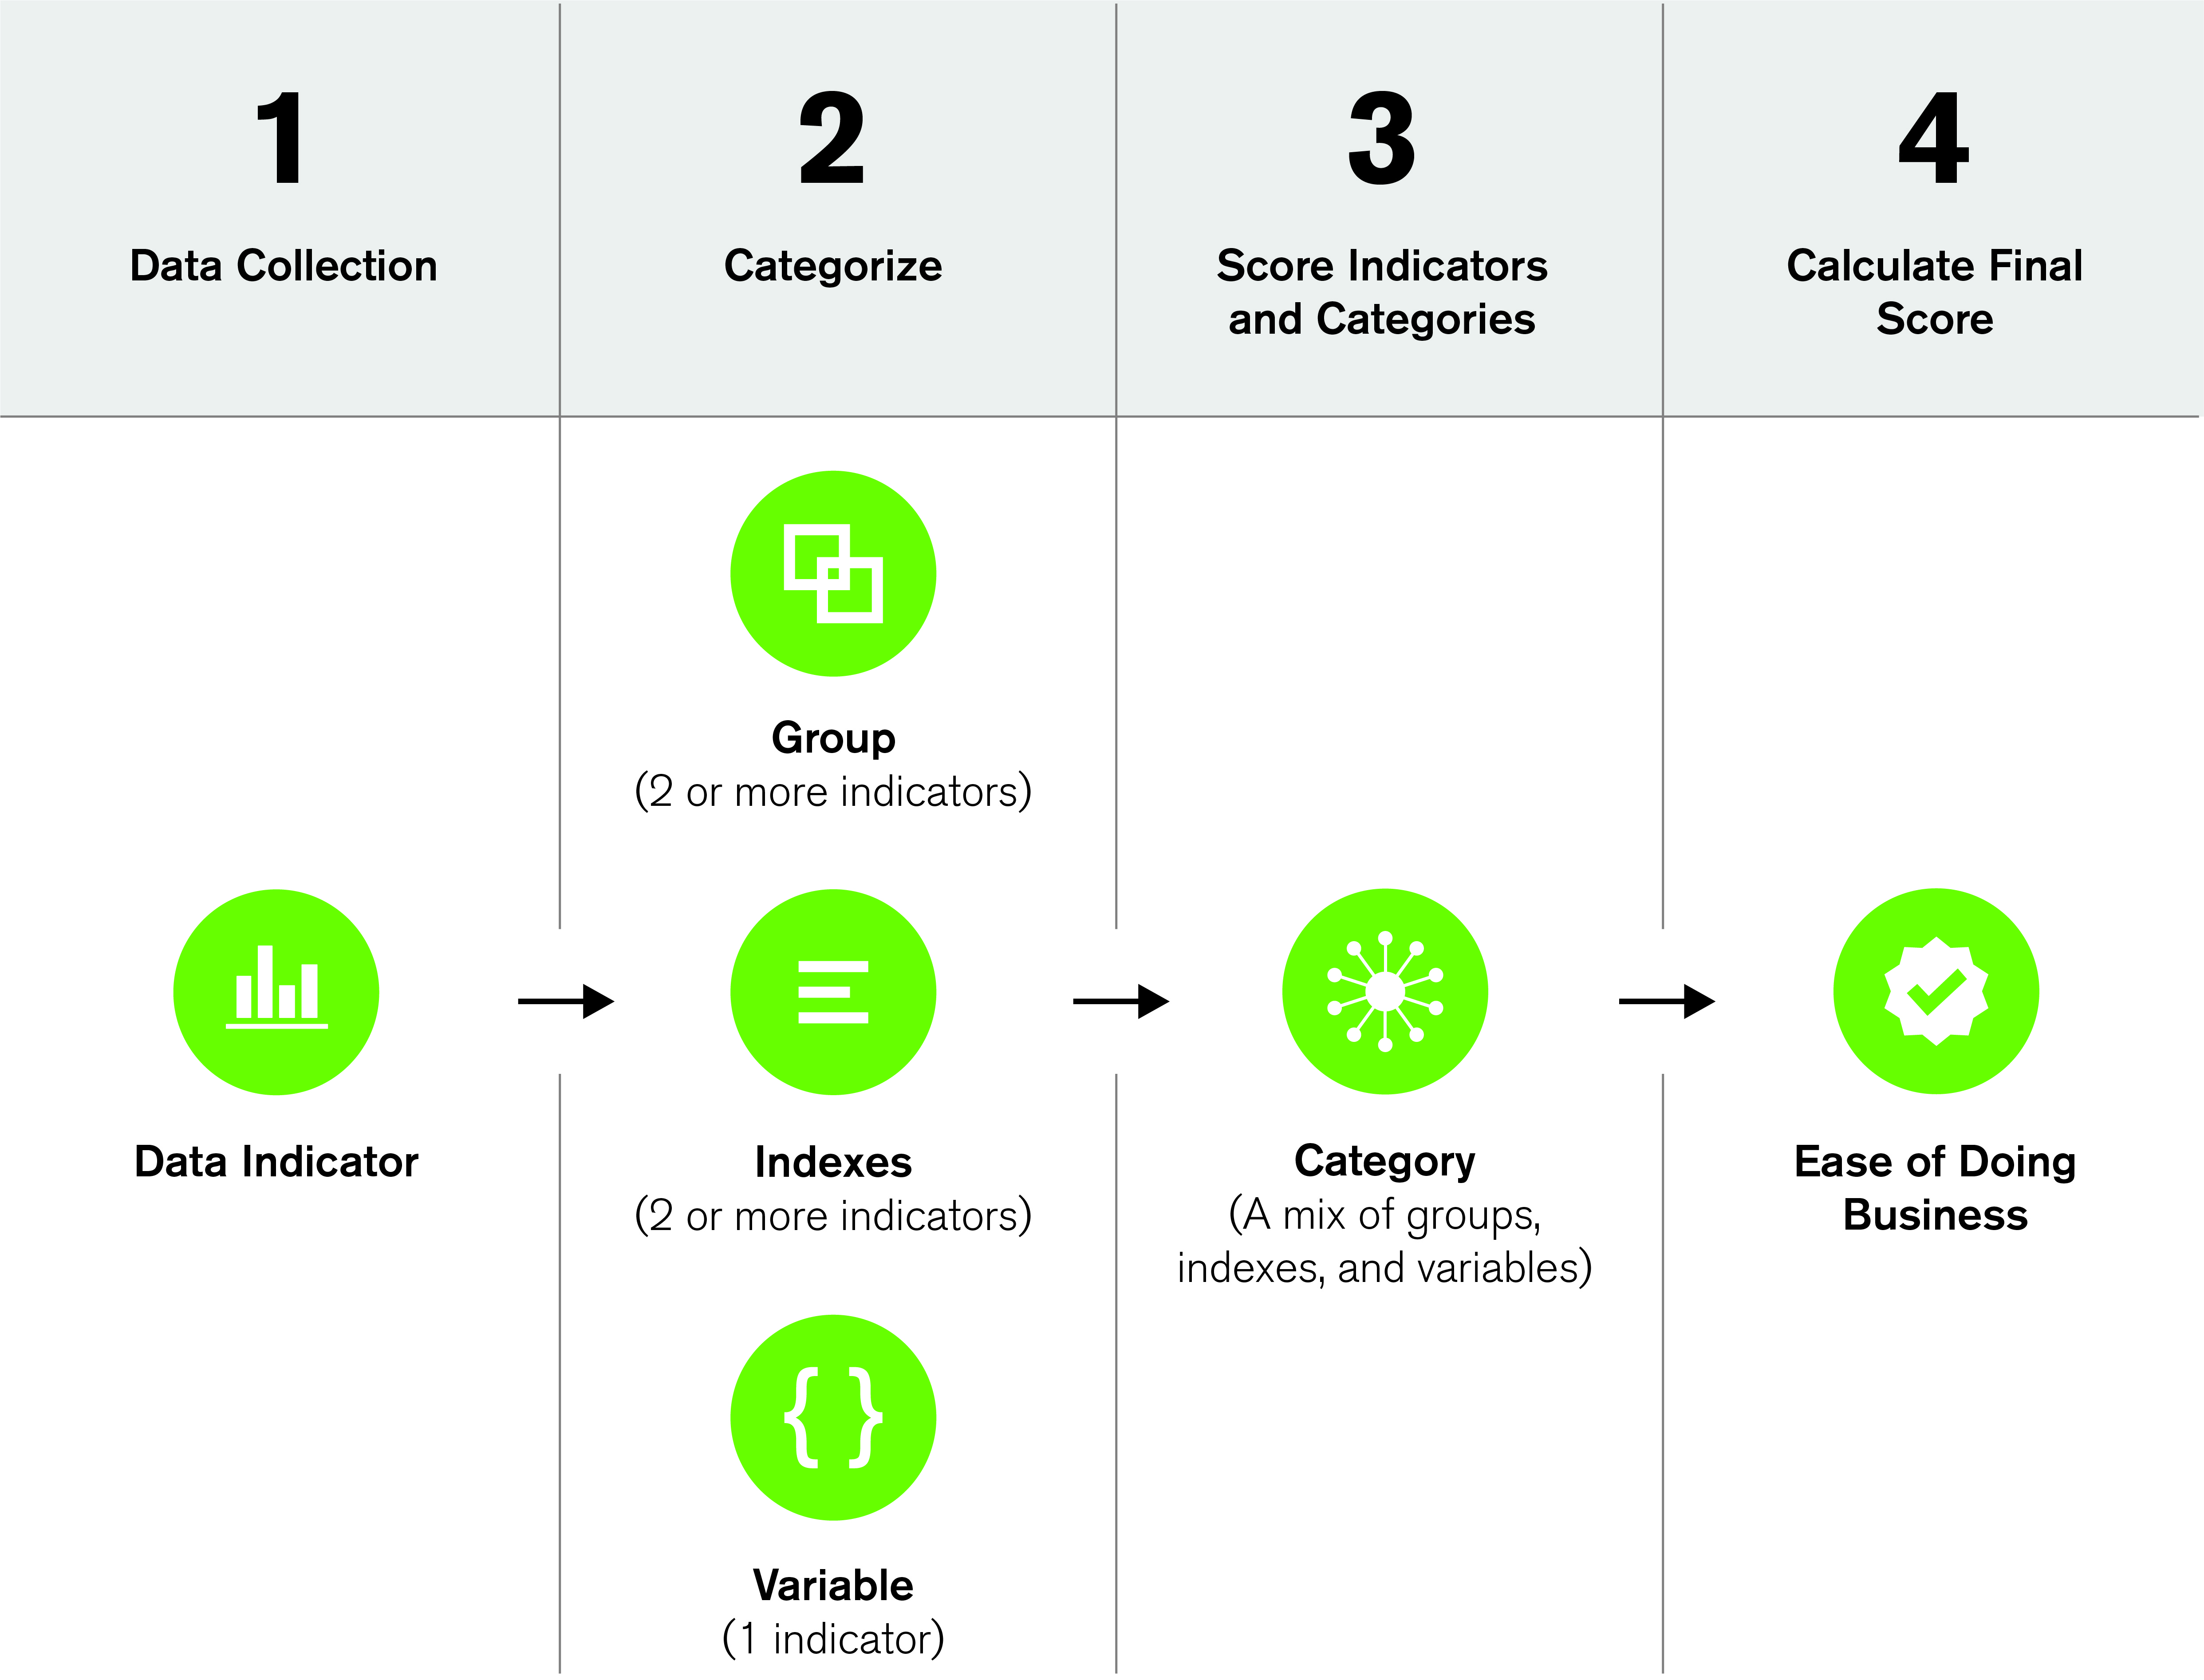
Steps 1 and 2: Collecting and Categorizing the Data
The "Doing Business North America" team collected data on 93 different regulatory and economic indicators across six different categories. The data collected came entirely from publicly available sources, including many published by the municipal governments we studied. Each observation is termed an “indicator.” Once collected, these indicators were then classified into one of three types: (i) a variable, (ii) a group, or (iii) an index.
Variable
A variable is the most common classification found throughout a dataset. These types of indicators are generally considered the most important, define the theme of the category, and are not combined into larger groups of indicators. To put it another way, a variable consists of only one indicator. For example, in the Starting a Business category, indicators that show the number of procedures to start a business, the time to establish a business, or the cost to start a business are all treated as variables. Although these three indicators have the same general theme, they each reflect an important and unique aspect related to the process of starting a business and make up the foundation of the category. They also use three different units of measurement — the procedures indicator measures the number of steps, the time indicator measures the number of days, and the cost indicator measures the number of dollars.
Group
Groups consist of two or more indicators that share similar attributes that can be combined. When combined, that group is considered a variable in the scoring process. An example of this can be seen in the Employing Workers category, in which there is a group of indicators measuring severance pay for workers with different tenure periods: There is an indicator that measures severance pay for workers with one year of tenure, an indicator for severance pay with five years of tenure, and an indicator for severance pay with 10 years of tenure. Because these three indicators all measure the same thing (but simply measure different time ranges) and all are measured using the same units, these three indicators are grouped together (in this case, averaged together) and then treated like a variable for scoring purposes. A group is the rarest collection of indicators found throughout the data.
Index
Indexes are a collection of indicators (similar to a group) that share a theme. However, there are two important conditions that must both be met for a collection of indicators to be treated as an index instead of as a group: (i) the indicators are binary in nature; and (ii) on their own, they do not rise to the importance of a variable but grouped together they describe an important element of the Ease of Doing Business analysis. An example of this can be seen in the Land and Space Use category, where there are several indexes used in the Quality of Land Administration Index, which itself is comprised of the Reliability of Infrastructure Index and the Transparency of Information Index. This transparency index measures various attributes of the land administration system, such as whether information on land ownership is made publicly available (a “yes” or “no” answer) or whether the agency in charge of immovable property registration commits to a specific time frame (a “yes” or “no” answer). These two indicators are grouped together to form an index. Additionally, indexes can be combined to form an even broader index as described above for the Registering Property category.
Finally, by the end of this process the data was categorized as either a variable (consisting of one indicator), a group (consisting of two or more continuous or binary indicators), or an index (consisting of two or more binary indicators). Each of them has equal weight in the category score (as we shall see soon).
Step 3: Scoring the Indicators and Categories
The indicators are scored following one of two procedures, depending on whether the data type is binary in nature (which is collapsed into indexes) or continuous in nature (which becomes variables on their own or combined in groups). Indexes and groups are also scored.
Binary Indicators
Binary indicators are the simplest of all the indicators. These indicators measure whether a policy exists. Locations where that policy exists are marked as 1 or “yes,” and locations where the policy does not exist are marked as 0 or “no.” Next, we determine whether the policy is harmful or beneficial to the ease of doing business — in other words, we decide whether a “1” or “yes” should be considered the best score or the worst score. So, for instance, if a policy is considered beneficial, locations with this policy (observations that are labeled with a 1 or “yes” in the data indicator) are awarded one point, and locations without this policy (locations that were labeled with a 0 in the data indicator) are awarded zero points. A collection of binary indicators can then be combined into an index by simply adding the ones and zeros to create the index score.
Continuous Indicators
The scoring of continuous indicators requires a little more work. The first step for analyzing a continuous indicator is to determine the default assumption about what is considered most favorable for the ease of doing business as described above. However, due to the large range of some indicators (indicators that either involve ratios or costs are notorious for having large variance) and the need to avoid outliers skewing the overall score, a threshold of two standard deviations greater than the mean is sometimes used to define the upper boundary for an indicator and a threshold of two standard deviations less than the mean is sometimes used to define the floor.
Once a specific numeric range and directionality have been established, a city’s score for that indicator is determined using the equation ((A-B)/(A-C))*10), where A is the lowest observation (or “lowest performer”) for an indicator, across all locations, B is the observation for the location being scored, and C is the highest observation (or “highest performer”) for an indicator across all locations. This calculation produces values within a range of zero to 10, where the location(s) with the lowest regulatory performance (or those outside two standard deviations from the mean) are awarded no points, and the location(s) with the best regulatory environment are awarded 10 points. Cities in between the top and bottom receive scores based on their relative position as defined by the equation — where they end up in relation to the “frontier” of the highest-ranked indicator value. This “distance to frontier” equation and scoring method for continuous indicators can be applied to all types of indicators.
Groups
This “distance to frontier” method is also used when scoring groups. The difference is that, after deciding the directionality, the sum of all indicator scores within the group is first divided by the number of indicators included in the group, producing an average for that group. Then that average is scored based on the group’s distance to the frontier using the formula above.
Indexes
Indexes are scored in a similar fashion. The top and bottom values are assigned and the numeric score is calculated using the “distance to frontier” formula.
Scoring the Categories
To generate a score for a particular category, the scores among all variables, groups, and indexes within the category must first be aggregated. That aggregate score is then divided by the total number of indicators. This creates an average for the entire category. The average value for a category is used so that locations with missing or incomplete data are still able to be ranked and scored in a similar fashion to those with a complete dataset and not penalized by lack of data. That average value is the category score.
Step 4: Calculating the Ease of Doing Business Score
The Ease of Doing Business Score is derived by averaging the indicator scores across all categories. Any effect of missing data is significantly reduced at this level of aggregation. This number is then multiplied by 10 to allow the final score to resemble a percentage (i.e., out of 100%).